


Custom alerts and data visualization let you quickly identify and prevent all kinds of network issues.
PRTG is a comprehensive monitoring tool for your entire IT infrastructure. It lets you keep a constant eye on your servers, applications, virtual environment, and important hardware, as well as many other network components.
Checkmk uses extra open-source addons for some functions such as advanced dashboards or NetFlow monitoring – this means additional work in setting up, operating, and maintaining the monitoring systems.
PRTG solves all this with its unparalleled set of included monitoring capabilities, its intuitive feel, easy-to-read dashboards, customizable alarms, network mapping, and more. This means you can stop juggling separate specialized tools that offer only isolated solutions and cost precious time.

IT monitoring should be quick and easy. Cumbersome and complicated network monitoring software creates unnecessary work for the administrator. PRTG makes monitoring as user-friendly as possible – no matter if you choose an on-prem installation or our cloud-based product.
Quick installation with automatic network discovery and smart setup for instant monitoring
Custom dashboard creation via drag & drop with easy-to-read visualized overviews
Different user interfaces for web, desktop, and mobile apps for monitoring on the go
Network of qualified implementation partners to support you with a smooth migration to PRTG
Diagnose network issues by continuously tracking the health, availability, and performance of your entire IT infrastructure. Show hardware parameters, application performance, network traffic, bandwidth usage, and other key metrics in real time. Visualize data in clear graphs and dashboards to identify problems more easily. Gain the overview you need to troubleshoot all kinds of issues in your network.
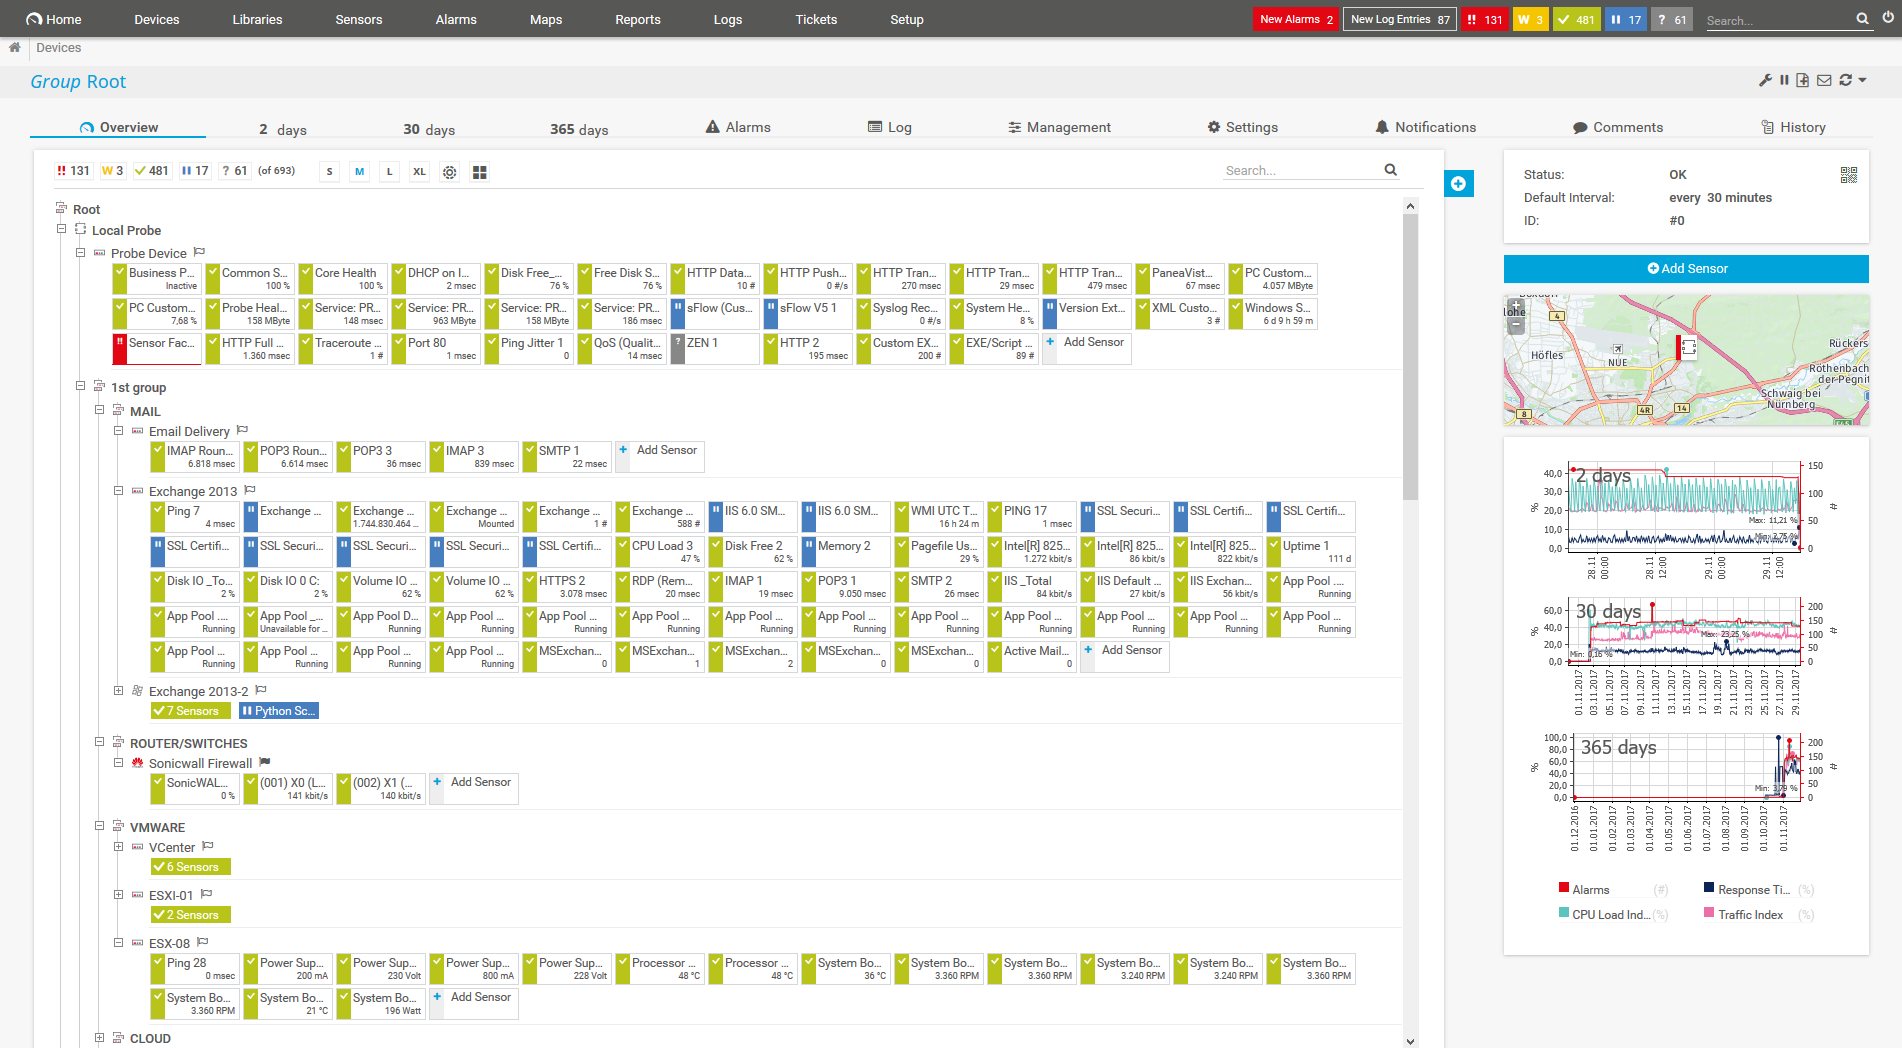
Device tree view of the complete monitoring setup

Custom PRTG dashboard for keeping an eye on the entire IT infrastructure

Live traffic data graph in PRTG
FEATURE | PRTG PRTG | Checkmk Checkmk |
|---|---|---|
One tool for your entire network | PRTG All monitoring features included | Checkmk Comprehensive monitoring platform with plugins for servers, applications, networks, and cloud infrastructure |
Easy setup, intuitive monitoring | PRTG User-friendly interfaces for web, desktop, and mobile | Checkmk Steeper learning curve with more complex configuration; web-based interface with customizable GUI but requires more technical expertise |
Automatic network discover | PRTG Included | Checkmk Auto-discovery feature detects hosts and services automatically and recommends suitable metrics and thresholds |
Real-time alerts & notifications | PRTG Advanced, highly customizable alerting via different notification methods | Checkmk Supports various notification channels including email, SMS, chat platforms, and third-party integrations like PagerDuty and ServiceNow |
Custom maps & dashboards | PRTG Custom dashboard creation via drag & drop | Checkmk Customizable dashboards available, but less intuitive than PRTG's drag-and-drop interface |
Agentless monitoring | PRTG No need to install agents on the monitored systems | Checkmk Supports both agent-based and agentless monitoring via SNMP, HTTP, or APIs |
On-premises or cloud-based | PRTG Flexible deployment options available | Checkmk Available for various Linux platforms, as container images, virtual appliances, and cloud marketplace images for AWS and Azure |
Enterprise version | PRTG Available | Checkmk Available |
Freeware version | PRTG Available for up to 100 sensors, free for life | Checkmk Checkmk Raw Edition is free and open-source |
Distributed network monitoring | PRTG Monitoring an unlimited number of remote locations included | Checkmk Distributed architecture that can monitor across hundreds of sites |
Server & application monitoring | PRTG Out-of-the-box integration, no extra cost | Checkmk Extensive server and application monitoring capabilities with specialized plugins for various applications |
Network performance monitoring | PRTG Out-of-the-box integration, no extra cost | Checkmk Comprehensive network monitoring with detailed metrics and thresholds |
Bandwidth monitoring | PRTG Out-of-the-box integration, no extra cost | Checkmk Monitors bandwidth usage at each port with customizable thresholds and alerts |
Network traffic analyzer | PRTG Out-of-the-box integration, no extra costs | Checkmk Network flow monitoring available through integration with ntopng (additional feature in Enterprise Edition) |
Cloud services monitoring | PRTG Out-of-the-box integration, no extra cost | Checkmk Cloud monitoring capabilities for AWS, Azure, Google Cloud Platform, and other cloud services |
Virtual infrastructure monitoring | PRTG Out-of-the-box integration, no extra cost | Checkmk Comprehensive monitoring for virtual environments including VMware, Hyper-V, and others |
Storage resource monitoring | PRTG Out-of-the-box integration, no extra cost | Checkmk Detailed storage monitoring with specialized plugins for various storage systems |
Database monitoring | PRTG Out-of-the-box integration, no extra cost | Checkmk Extensive database monitoring support for MySQL, PostgreSQL, Oracle, Microsoft SQL Server, and others |
Web performance monitoring | PRTG Out-of-the-box integration, no extra cost | Checkmk Web monitoring capabilities with synthetic monitoring through Robotmk integration in newer versions |
Supports leading technologies | PRTG SNMP, flow protocols, packet sniffing, WMI, HTTP, ping, SQL, and much more | Checkmk Supports a wide range of protocols and technologies including SNMP, SSH, WMI, HTTP, and specialized APIs |
Create your own scripts | PRTG Own PRTG API included for custom sensors and scripts | Checkmk Extensible with Python-based custom plugins and Check API for developing custom monitoring solutions |
Includes technical support | PRTG Expert support included, no extra costs | Checkmk Free community support for Raw Edition; paid technical support for Enterprise, MSP, and Cloud editions |
“All-around winning
network monitor”
“The real beauty of PRTG is the endless possibilities it offers”
“PRTG Network Monitor
is very hard to beat”
PRTG is set up in a few quick clicks and runs completely without the need for agents. Its smart auto-discovery feature automatically adds relevant endpoints and suitable sensors to your monitoring environment. You can also tailor PRTG to your needs and create your own custom sensors.
Checkmk also offers automatic network and service discovery as well as out-of-the-box integration plug-ins. However, while HTTP-, SNMP-, and API-based monitoring with Checkmk works without agents, all other monitoring requires the installation of a Checkmk agent on the monitored server or workstation.
PRTG is designed with an intuitive user interface for excellent usability. With PRTG, sensors and measurement points can be added with just a few clicks. Easy-to-read visualizations of your network as well as customizable dashboards and network maps let you determine the status of your network at one quick glance.
Checkmk also provides graphic maps and charts that are, however, less sophisticated in look & feel. With Checkmk, it is not possible to create your own comprehensive and interactive network maps, as you can do with the PRTG map designer.
Every PRTG subscription comes with the full range of monitoring features, including network traffic analysis, syslog monitoring, or flow monitoring. License prices are based on the number of required PRTG sensors. Each sensor covers several monitoring metrics, the so-called channels.
With Checkmk, prices are based on the number of services. A service can cover the same scope as a PRTG sensor, or it can be just a specific metric, which corresponds to the channel of a PRTG sensor. Even if pricing differs in terms of definition, the costs for PRTG and Checkmk are about the same.
However, with Checkmk, specific functionalities need extra open-source integrations, which do not cost extra, but require lots of extra time for configuration and maintenance.
You are interested to know if PRTG could be an alternative to your Checkmk implementation?

PRTG is set up in a matter of minutes and can be used on a wide variety of mobile devices.

We also compared PRTG with other monitoring tools:
The basic version of the open-source tool Nagios is free of charge. But most users spent many hours to set up and customize the tool. In case of problems, browsing through forums is often the only solution.
SolarWinds might be interesting for extremely complex network environments. But it also means you need to invest in higher costs for a platform made up of different modules and add-ons (that cost extra).
Zabbix is open-source software with a strong community support. But it requires lots of manual configuration work to install and set it up. You also need to install agents on the monitored systems.
PRTG and ManageEngine might seem similar at first. However, with ManageEngine, you have to choose between individual functions and purchase several modules to access the full range of features.
Real-time notifications mean faster troubleshooting so that you can act before more serious issues occur.
Partnering with innovative IT vendors, Paessler unleashes synergies to create
new and additional benefits for joined customers.
Paessler and Plixer provide a complete solution adding flow and metadata analysis to a powerful network monitoring tool.
IT that works constitutes a business-critical basis for a company's success. Availability and security must be defined for the respective purpose and closely monitored – by OT and IT alike.
Siemon and Paessler bring together intelligent building technology and advanced monitoring and make your vision of intelligent buildings and data centers become reality.
Network Monitoring Software – Version 25.2.106.1114 (May 05th, 2025)
Download for Windows and cloud-based version PRTG Hosted Monitor available
English, German, Spanish, French, Portuguese, Dutch, Russian, Japanese, and Simplified Chinese
Network devices, bandwidth, servers, applications, virtual environments, remote systems, IoT, and more
Choose the PRTG Network Monitor subscription that's best for you
Choosing between Paessler PRTG and Checkmk depends on several factors, such as your specific network monitoring needs, budget, and technical resources available in your organization.
PRTG is ideal:
Checkmk might be your choice:
PRTG offers a comprehensive overview of your IT systems in real time. It supports all the leading monitoring technologies, including:
With our free monitoring tool, you get:
With the freeware edition of PRTG, you can get started with network monitoring in a matter of minutes. Our auto-discovery function detects all the devices within a given IP address range and automatically incorporates them into your monitoring environment.
PRTG’s flexible subscription licensing makes it easy to scale up or down as needed. You pay only for the number of sensors you need. After your 30-day free trial of the unlimited version of PRTG, you can still use the free version with 100 free sensors. View our pricing.
In PRTG, “sensors” are the basic monitoring elements. One sensor usually monitors one measured value in your network, for example the traffic of a switch port, the CPU load of a server, or the free space on a disk drive. On average, you need about 5-10 sensors per device or one sensor per switch port.
Paessler conducted trials in over 600 IT departments worldwide to tune its network monitoring software closer to the needs of sysadmins. The result of the survey: over 95% of the participants would recommend PRTG – or already have.

You are interested to know if PRTG could be an alternative to your Checkmk implementation?
