


Custom alerts and data visualization let you quickly identify and prevent all kinds of network issues.
Because enterprise environments have many moving parts, a fast, accurate monitoring system is absolutely critical. Real-time data collection ensures you can respond quickly to issues, before they cause unplanned downtime (or the blue screen of death). And accuracy ensures effective troubleshooting and optimization.
But you know this already.
What you might not have considered is the impact your network monitoring solution might have on your system's resources. Put simply, at which point does your monitoring tool hoover up so many resources that it cancels out its benefits?
With PRTG, you won't have to find out.
While you can use it with agents if you want to, you can run a completely agentless setup, using SNMP, Flow technologies, WMI, and other protocols to gather data. That means you'll have a comprehensive, real-time view you can trust, without overloading your system and sacrificing performance.

Gain real-time insights into your network’s health and performance, without hoovering up precious resources.
PRTG’s comprehensive monitoring capabilities, support for unlimited network devices, and flexible, agentless deployment maximize observability and ensure prompt troubleshooting while minimizing the impact on your system.
Quick installation with automatic network discovery and smart setup for instant monitoring
Custom dashboard creation via drag & drop with easy-to-read visualized overviews
Different user interfaces for web, desktop, and mobile apps for monitoring on the go
Network of qualified implementation partners to support you with a smooth migration to PRTG
Diagnose network issues by continuously tracking the health, availability, and performance of your entire IT infrastructure. Show hardware parameters, application performance, network traffic, bandwidth usage, and other key metrics in real time. Visualize data in clear graphs and dashboards to identify problems more easily. Gain the overview you need to troubleshoot all kinds of issues in your network.
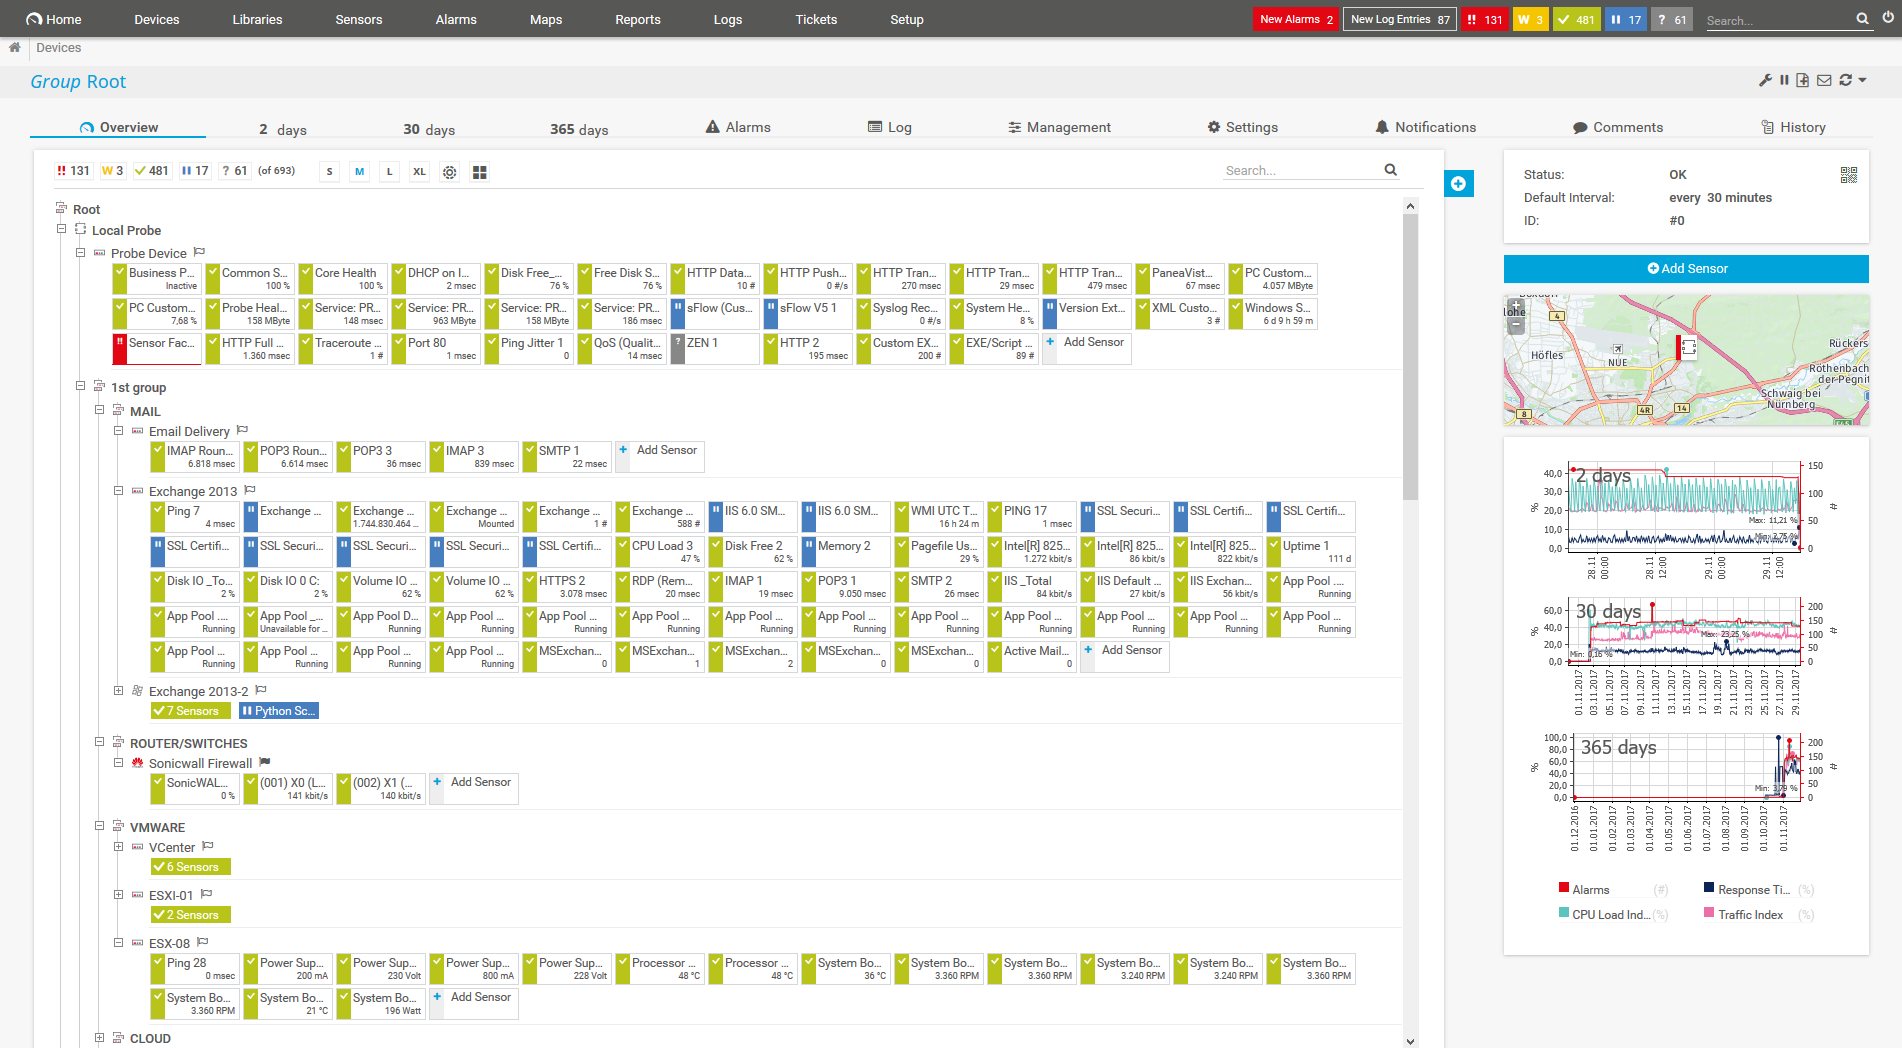
Device tree view of the complete monitoring setup

Custom PRTG dashboard for keeping an eye on the entire IT infrastructure

Live traffic data graph in PRTG
FEATURE | PRTG PRTG | Netdata Netdata |
|---|---|---|
One tool for your entire network | PRTG All monitoring features included | Netdata All monitoring features included |
Easy setup, intuitive monitoring | PRTG User-friendly interfaces for web, desktop, and mobile | Netdata User-friendly cloud-based setup |
Automatic network discover | PRTG Included | Netdata Supported, but limited compared to PRTG |
Real-time alerts & notifications | PRTG Advanced, highly customizable alerting via different notification methods | Netdata Customizable alerts and integrations |
Custom maps & dashboards | PRTG Custom dashboard creation via drag & drop | Netdata Only auto-generated dashboards available |
Agentless monitoring | PRTG No need to install agents on the monitored systems | Netdata Not supported |
On-premises or cloud-based | PRTG Flexible deployment options available | Netdata Available |
Enterprise version | PRTG Available | Netdata Available |
Freeware version | PRTG Available for up to 100 sensors, free for life | Netdata Available |
Distributed network monitoring | PRTG Monitoring an unlimited number of remote locations included | Netdata Supported |
Server & application monitoring | PRTG Out-of-the-box integration, no extra cost | Netdata Supported |
Network performance monitoring | PRTG Out-of-the-box integration, no extra cost | Netdata Supported |
Bandwidth monitoring | PRTG Out-of-the-box integration, no extra cost | Netdata Supported |
Network traffic analyzer | PRTG Out-of-the-box integration, no extra costs | Netdata Supported |
Cloud services monitoring | PRTG Out-of-the-box integration, no extra cost | Netdata Supported |
Virtual infrastructure monitoring | PRTG Out-of-the-box integration, no extra cost | Netdata Supported |
Storage resource monitoring | PRTG Out-of-the-box integration, no extra cost | Netdata Supported |
Database monitoring | PRTG Out-of-the-box integration, no extra cost | Netdata Supported |
Web performance monitoring | PRTG Out-of-the-box integration, no extra cost | Netdata Supported |
Supports leading technologies | PRTG SNMP, flow protocols, packet sniffing, WMI, HTTP, ping, SQL, and much more | Netdata Supported |
Create your own scripts | PRTG Own PRTG API included for custom sensors and scripts | Netdata Possible, but limited compared to PRTG |
Includes technical support | PRTG Expert support included, no extra costs | Netdata Available support varies by plan |
“All-around winning
network monitor”
“The real beauty of PRTG is the endless possibilities it offers”
“PRTG Network Monitor
is very hard to beat”
Simple to set up. Flexible deployment. Cost-effective operation.
Whether you run a small local network or a large, distributed environment, PRTG gives you the in-depth, real-time insights you need to optimize performance and ensure stability and reliability, without breaking the bank or system bandwidth.
PRTG’s powerful automations make setup, anomaly detection, troubleshooting, and optimization quick and painless. Auto-Discovery finds all connected devices and assigns the appropriate sensors. Pick your preferred performance metrics and alert thresholds, and the system will keep a close eye on everything 24/7 so you don’t have to.
Build a complete picture of your IT infrastructure's health and performance, with one single network monitoring tool — apps, response times, uptime, AWS, Azure, and other virtualized environments... even log management. With 250+ preconfigured sensors and the ability to create custom sensors, PRTG can monitor every performance metric imaginable.
No need to install specialized software agents. PRTG uses SNMP, WMI, and other protocols, and remote management to minimize system impact. Plus, you can deploy it on-premises, in the cloud, or as a hybrid environment, PRTG can do it, without sacrificing simplicity or ease of use. We even have a Linux-compatible hosted solution.
No more unpleasant surprises. PRTG’s sensor-based pricing model is simple and straightforward, ensuring you always know exactly how much your bill will come to. Plus, the first 100 sensors are free, forever and have all features included. Which means you can start monitoring at no cost and scale up as your needs become more complex.
You are interested to know if PRTG could be an alternative to your Netdata implementation?

PRTG is set up in a matter of minutes and can be used on a wide variety of mobile devices.

We also compared PRTG with other monitoring tools:
New Relic offers strong asset performance management and observability, but full IT infrastructure monitoring can be costly and requires a fair amount of manual configuration.
SolarWinds might be interesting for extremely complex network environments. But it also means you need to invest in higher costs for a platform made up of different modules and add-ons (that cost extra).
Prometheus is an open-source tool that excels at monitoring containerized applications. However, it lacks comprehensive network monitoring capabilities and requires extensive manual configuration for infrastructure visibility.
Site24x7 is a robust all-in-one monitoring tool, but its cloud-only model and pricing can be costly and impractical for large, complex IT setups or on-premises monitoring needs.
Real-time notifications mean faster troubleshooting so that you can act before more serious issues occur.
Partnering with innovative IT vendors, Paessler unleashes synergies to create
new and additional benefits for joined customers.
Axis offers one of the most complete and reliable product portfolios, an expanded professional network, and comprehensive integration support for video management software.
A combination of Orchestra and PRTG provides the ideal solution to monitor the traditional IT Infrastructure as well as the central communication server in hospitals and industrial environments.
Paessler PRTG integrates Wago systems into the higher-level monitoring of IT, security and production systems, thus creating a central overview.
Network Monitoring Software – Version 25.2.106.1114 (May 05th, 2025)
Download for Windows and cloud-based version PRTG Hosted Monitor available
English, German, Spanish, French, Portuguese, Dutch, Russian, Japanese, and Simplified Chinese
Network devices, bandwidth, servers, applications, virtual environments, remote systems, IoT, and more
Choose the PRTG Network Monitor subscription that's best for you
Choosing between Paessler PRTG and Netdata depends on several factors, such as your specific network monitoring needs, budget, and technical resources available in your organization.
PRTG is ideal:
Netdata might be your choice:
Netdata can monitor with 1-second granularity, so it's ideal for ultra-high frequency environments like trading platforms, logistics, large-scale IT microservices, and IoT deployments.
With PRTG, on the other hand, you get minute-level granularity by default, with the option to set lower intervals. This is the most common use case for most enterprise environments, as it ensures comprehensive monitoring of your infrastructure's health and performance and effective troubleshooting without overloading your resources.
The short answer is: it depends. The decentralized model of Netdata’s monitoring solution makes it ideal if your primary use case is high-frequency, distributed monitoring. But, because you have to install an agent on every node — that is, on every part of your system which you want to monitor — it can become resource-heavy, complex to manage, and require lots of manual configuration.
Scaling PRTG in a large, high-frequency environment may also require some manual configuration. But, because it supports agentless monitoring, it's lighter on your resources and setup is more straightforward.
PRTG uses sensor-based pricing, so you pay for the metrics you want to monitor, not for specific features or functionality. All PRTG's features and functionalities are included in the base price — yes, even support — and you pay the same regardless of whether you deploy PRTG on-premises, in the cloud, or use a hybrid setup. You also get free lifetime access to 100 sensors, with all monitoring features included.
Netdata's core agent is free and open source. But if you want to access advanced features, centralized management, and longer data retention capabilities, you'll need to pay per node you want to monitor. Netdata defines a node as being a physical device, virtual machine, container, or cloud deployment. The cheapest plan has a minimum requirement of 10 nodes.
In PRTG, “sensors” are the basic monitoring elements. One sensor usually monitors one measured value in your network, for example the traffic of a switch port, the CPU load of a server, or the free space on a disk drive. On average, you need about 5-10 sensors per device or one sensor per switch port.
Paessler conducted trials in over 600 IT departments worldwide to tune its network monitoring software closer to the needs of sysadmins. The result of the survey: over 95% of the participants would recommend PRTG – or already have.

You are interested to know if PRTG could be an alternative to your Netdata implementation?
